How to Measure the ROI of Leadership Development Without a Data Team
You don't need an analytics team to prove leadership development ROI. Agree on the problem, use data you already have and compare before and after.

Sooner or later, someone in finance asks the question every HR and L&D leader dreads: "What did we get for the money we spent on leadership development?" If your answer is a stack of satisfaction surveys and a few nice comments, the budget conversation next year is going to be hard.
The good news is that you don't need a data science team, a new platform or a six-figure analytics project to show the value of leadership development. You need a clear question, a small number of indicators you already collect, and the discipline to look at them before and after. This guide shows you how to build a credible leadership development ROI story with the tools and data you already have.
Why leadership ROI feels so hard to prove
Leadership development is harder to measure than, say, a new piece of software, for a few honest reasons:
- The effects are indirect. A better manager doesn't close a sale; they create the conditions for their team to do better work.
- The timeline is longer. Behavior change shows up over months, not days.
- Many things change at once. A new hire, a reorganization or a busy season can move the same numbers you're watching.
None of this makes measurement impossible. It just means you have to be specific about what you expect to change, and modest about what you claim.
It also helps to remember why the effort is worth it. Gallup's State of the Global Workplace research estimates that low engagement costs the global economy about $10 trillion, roughly 9% of global GDP — and managers have an outsized influence on engagement. You won't capture a share of a number that big in your own spreadsheet, but it's a useful reminder that the stakes are real.
Start with the decision, not the dashboard
The most common mistake is collecting data first and hunting for a story afterward. Flip that around. Before the program starts, sit down with the business leader who owns the problem and agree on three things:
- The business problem. For example, "We lose too many new hires in their first 90 days on the evening shift."
- The leadership behavior that drives it. For example, "Supervisors don't check in with new hires in their first two weeks."
- The indicators you'll watch. For example, 90-day retention for evening hires, and how many new hires report a weekly check-in with their supervisor.
Write those down and have the business leader sign off. That one page is worth more than any dashboard, because it turns a soft program into a test of a specific idea.
If you can't name the number you expect to move before the program starts, you won't be able to defend it after the program ends.

Use the data you already have
Most organizations already track plenty of useful signals. They're just scattered across HR, operations and finance. Good candidates include:
- Retention and turnover, especially early turnover and regretted losses, by manager or team.
- Engagement or pulse-survey items that relate to the behavior you're training, such as "My manager gives me useful feedback."
- Operational metrics your leaders already watch: customer complaints, escalations, rework, safety incidents, overtime or absenteeism.
- Internal mobility, such as how many roles are filled from within.
- Simple behavior counts, like the share of team members who had a one-on-one in the past month.
Pick two or three. More than that and you'll spend your time reporting instead of improving.
A simple before-and-after method
You can build a credible measurement approach with nothing more than a spreadsheet.
Set a baseline
Pull the last six to twelve months of each indicator for the teams in the program. If you can, pull the same data for a few similar teams that aren't in the program yet. That comparison group is the single most useful thing you can add, and it costs nothing.
Check behavior, not just results
Results lag. Behavior moves first. At 30 and 60 days, ask participants and their teams short questions about the specific behavior you trained: "In the past two weeks, did your supervisor check in with you about how you're doing?" If behavior isn't changing, results won't either, and you can adjust early.
Compare at 90 and 180 days
Look at your indicators again. Did they move for the program group? Did they move more than for the comparison group? Write down anything else that changed in that period, such as a staffing change or a new policy, so you can be honest about other explanations.
Translate into dollars, carefully
Where it makes sense, put a conservative dollar figure on the change. If your organization already has an estimate for the cost of replacing an hourly employee, multiply it by the number of departures you avoided compared with the baseline. Use your finance team's own numbers, not industry averages, and round down. A conservative figure finance believes is far more valuable than an impressive one they don't.
Tell the story finance will trust
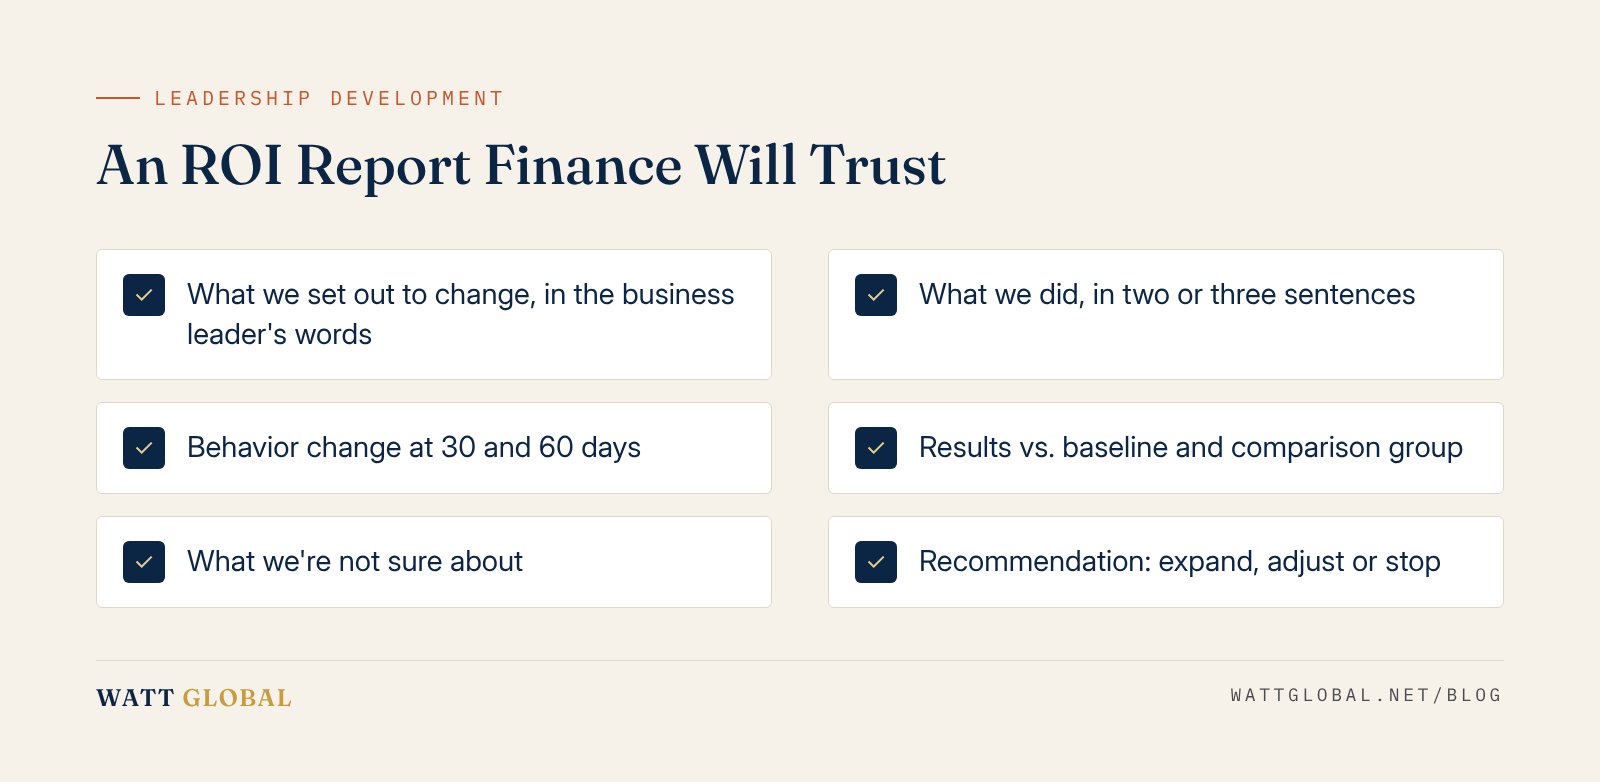
When you report back, keep it short and structured:
- What we set out to change, in the business leader's words.
- What we did, in two or three sentences.
- What changed in behavior, with the 30- and 60-day check-in results.
- What changed in results, compared with the baseline and the comparison group.
- What we're not sure about, including other factors that may have contributed.
- What we recommend next, including whether to expand, adjust or stop.
That last "not sure" section feels risky, but it builds trust. Finance leaders know that real-world data is messy. Showing you know it too makes the rest of your story more believable.
Common traps to avoid
A few mistakes undermine otherwise good measurement:
- Measuring only satisfaction. People enjoying a workshop is nice, but it isn't evidence of change.
- Claiming every improvement. If the whole company's turnover dropped, your program didn't cause all of it.
- Changing the indicators halfway through. Pick them up front and stick with them, even if one looks disappointing.
- Waiting a year to look. Check behavior early so you can fix the program while it's still running.
Make measurement part of the design
The organizations that prove leadership development ROI aren't the ones with the best analytics. They're the ones that decide what success looks like before the first session and review it on a schedule afterward. That's the Wisdom and Transformation stages of the WATT Framework at work: get clear on the goal, then hold yourself to it.
At WATT Global, coaching and team engagements are measured against indicators agreed with leadership before the work begins, so the results conversation is built in rather than bolted on. If you'd like help choosing the right indicators for your next program, or reviewing one that's already underway, get in touch with our team and we'll talk through what you're already tracking.